 |

Quantitative Tone Chroma Aaron Andrew Hunt
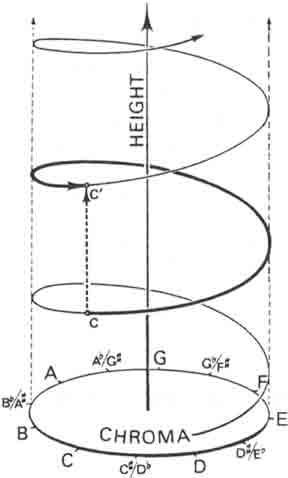
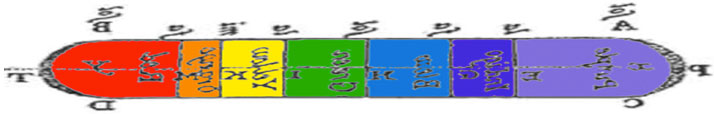
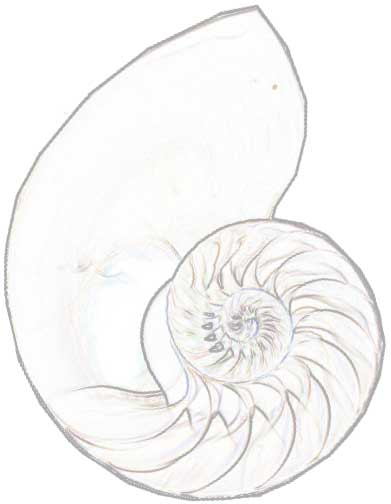
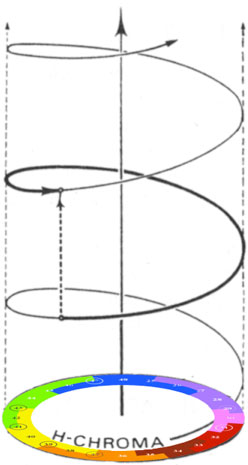
Researchers in psychoacoustics often refer to a model of pitch as shown at left. This is a
two dimensional model in which the vertical axis shows the height of a pitch, while the
radial position on the spiral shows the chroma of the pitch. The pitch height
corresponds to octave placement or register. The word chroma literally
means color in Greek, and in this model as the term is intended to correspond to the chromatic
set of twelve pitches known in traditional Western music theory; hence, the names of these twelve tones are shown
around the base of the model, and enharmonic equivalents show that the assumption is
twelve tone equal temperament.
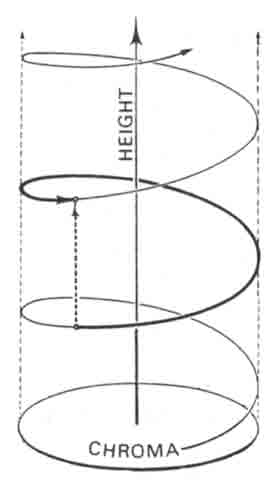
As explained elsewhere this text, our perception of the gradation of divisions within an octave
is much finer than the equal division of twelve tones. Knowing this, it is alarming that the most
pervasive model for pitch in psychoacoustic literature uses those twelve tones as its touchstone. Therefore, the
first order of business is to do away with the twelve tone assumption, and find a better means of delimiting
this attribute of pitch that is being called chroma; hence, the figure at right shows the model with the
twelve-tone letter names removed.
Further, if this attribute of pitch is to be called chroma, it would seem fitting that
color should actually play a role. In order to be useful for scientific
research, the way color is used should be quantifiable in a scientific way.
Measurements in science are based on naturally
occurring phenomenae, which are more or less reducible to mathematical relationships.
Although twelve equidistant tones do provide some musically meaningful means of measurement, they are not a naturally
occurring structure in the world of sound, and they provide no useful mathematical
basis for research in psychoacoustics.
H-Chroma is a quantitative tone chroma
based on the idea that colors can be directly related to numbers
in such a way that researchers have a model for pitch that is mathematically useful.
H-Chroma also has clear applications in musical notation and instrument design for Just Intonation,
as it provides an immediately obvious relationship between visual and aural stimuli that is based on numbers.
|
 |
When I was a graduate student at the College-Conservatory of Music at the University of Cincinnati (1994-96), one of
my many composition teachers was Dr. Allen Sapp. At the close of one of my weekly lessons,
Dr. Sapp gave me a book called ITTEN: The Elements of Color,
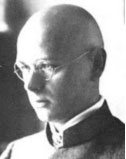
about the color theory of Johannes Itten (1888-1967).
Itten was one of the founders of the Bauhaus school in Weimar. I didn't know it at the
time, but Itten's book on color theory is
well known, and in particular his version of the color wheel is quite famous.
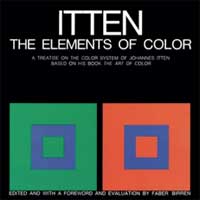

Itten, Johannes. ed. Birren, Faber. ITTEN : the Elements of Color. New York: John Wiley & Sons, Inc, 1970.
In that book, Itten speaks about color in musical terms. In particular, he associates the attribute of hue
with musical pitch. Such a notion was not new. Although he lacked scientific rigor,
Itten formed the basis of his arguments from scientific literature.
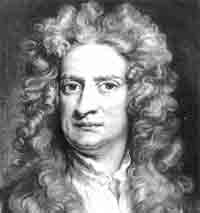
In particular, he based the pitch-color association fundamentally on the early 18th Century
work of Sir Isaac Newton (1643-1727), who had published Opticks in 1718, which contained his
experiments and insights into the nature of light and color.
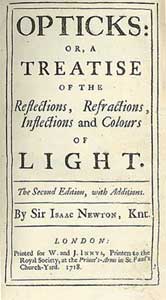
Newton. Opticks: Or, A Treatise of the Reflexions, Refractions, Inflexions and Colours of Light.
London: Sam. Smith & Benj. Walford, 1704.
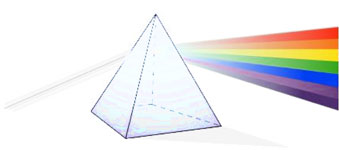
The suggestion of Newton and the subject of light and color normally brings to mind
the image of light traveling through a prism, breaking up into the component colors of the visible spectrum;
however, the most important experiments associated with Newton's discoveries about colors and light involve
not a prism, but a set of stacked lenses from an experiment Newton carried out in 1685.

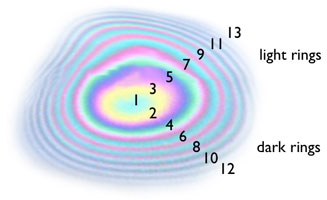
Light passing through such stacked lenses produces a pattern of colored rings which are known as Newton's Rings.
Newton found that the squares of the diameters of such rings corresponded to a series of natural
numbers, the odd numbers corresponding to light rings, and the even numbers corresponding to dark rings.
Newton measured the distances between the bands of color in these rings, and made the following figures.
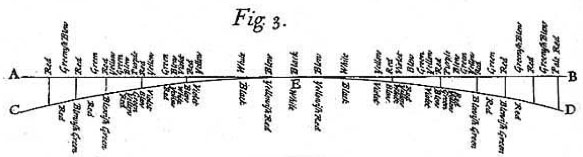
Although Newton was not well versed in music theory, during the process of drawing up these figures he began
to apply the musical knowledge he had at hand.
Eager to find a relationship between the colors he was observing and some aspect of music,
Newton loosely applied his limited knowledge of hexachordal music theory, and
found that the relationships between the cube roots of the squares of the distances between the colors he observed were
"... to one another very nearly as the sixth lengths of a Chord which found the Notes in a sixth Major."
He wrote further that "the thicknesses of the Air between the Glasses there ...
are to one another as the ...
lengths of a Chord, which found the Notes in an eighth."
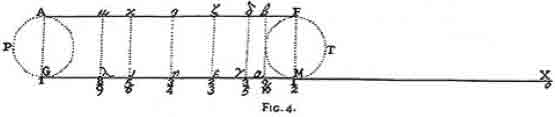
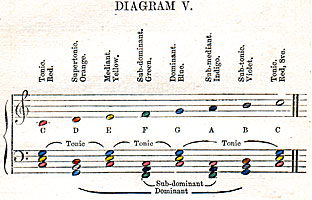
In figure 4, Newton shows a series of ratios which look an awful lot like those found in tuning theory.
If we look closely at these ratios and order them from left to right, we indeed find a musical scale.
Applying pitch names to this scale, we find it is in fact a Dorian scale in Just Intonation, having
a large Minor Third and a Small Major Sixth.

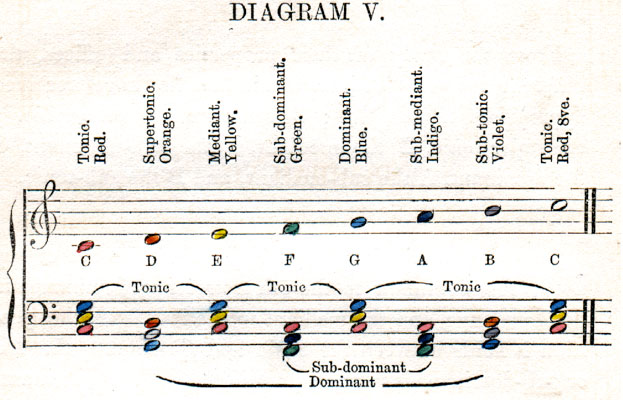
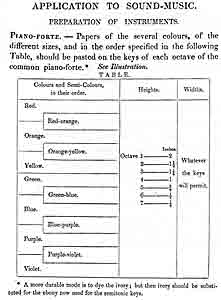
Newton follows this figure with another (figure 5) which shows the names of each color band.
The figure below is a colorized version of that drawing.
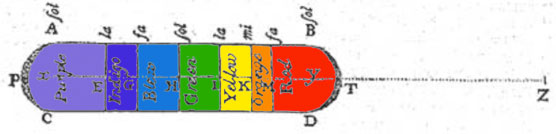
If we flip this figure horizontally, we find the familiar series of spectral hues that everyone learns
in school: Red, Orange, Yellow, Green, Blue, Indigo, and Violet, commonly taught encouraging the use of
the mnemonic, ROYGBIV.


What Newton was actually positing, which is rarely noted, is that the boundaries between these color
categories fall at distances which correspond to the distances between the pitches of a Dorian scale
in Just Intonation.
Newton's assertion was promptly rejected by the scientific community of his day, and was derided as
pseudoscience by his successors, most notably Herman von Helmholtz (1821-1894) who decried
Newton's analogy as bunk in his seminal volume which marked the birth of psychoacoustics,
On The Sensation of Tone.
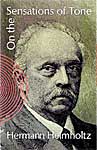
Helmholtz, Hermann L. F. On the Sensations of Tone:
As a Physiological Basis for the Theory of Music New York: Dover, 1954. (German 4th Edition, 1877).
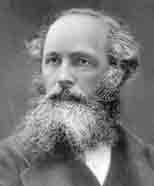
Helmholtz's understanding of light was of course much more advanced than was Newton's understanding.
The basis of modern understanding of the visible spectrum is attributed to James Clerk Maxwell
(1831-1879), who defined visible light as just a small part of the wider spectrum of
electromagnetism.
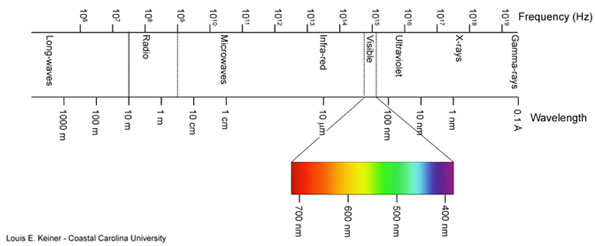
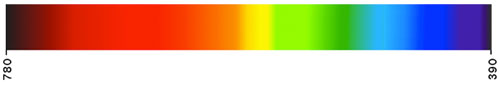
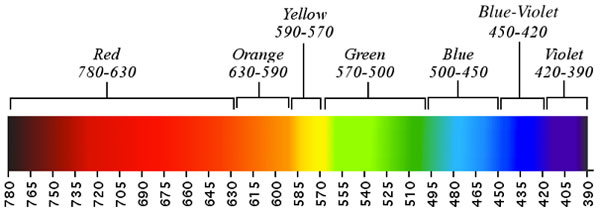
According to Maxwell's model, visible light is a continuum within a portion of the electromagnetic
spectrum having clear categorical bands, but
no clear delineations between those bands. Measurements of light waves are typically taken in nanometers
or billionths of a meter, and the visible spectrum is normally considered to span from about 780 nm to
390 nm within the electromagnetic spectrum.
Because there are no clear deliniations, no two sources in the scientific literature agree on the
nanometric values which demarcate the color bands of the spectrum; however, generally all sources adhere to Newton's
idea of seven categories: ROYGBIV.

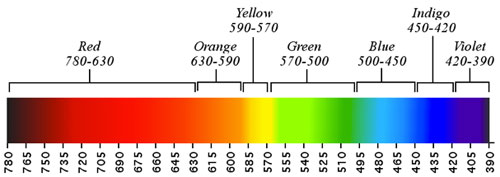
The value shown here are those used by Johannes Itten in The Elements of Color. If you have
ever wondered why there were two categories around the blue area in the common paradigm, you are not
alone. Why both Blue and Indigo? The reason is of course the musical analogy. There were seven
diatonic tones, so there must be seven color categories. Although Itten
adhered to that precedent, it is important to note that Itten
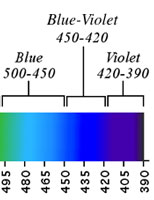
does not refer to Indigo, but rather to Blue-Violet. This is a reflection of Itten's
systematic approach to color theory.
Knowing that Itten was no scientist, I did some homework to check his numbers (the nanometers)
against respected sources in modern scientific literature, such as Optics by Eugene Hecht. Although
I found that no two sources agree on exact numbers, Itten's values were in fact in line with all of the
sources I checked.
Hecht, Eugene. Optics. Hecht. Reading, Mass: Addison-Wesley, 1998.
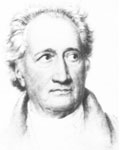
Itten's application of color theory has its roots in practical art history and the idea of primary
colors. The first written records of such a theory of colors are usually cited as
Goethe (1749-1832) and Chevruel (1786-1889).
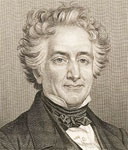
The theory of primary colors was being practiced long before it was written about. It was first systematically
explored in the 18th Century by Jacob Christoph Le Blon (1667-1741), who invented the first three-color
printing process using primaries Red, Yellow, and Blue.

Although the RYB model has long been superseded by CMYK and other models in the printing industry,
in the kindergarten classroom (and generally in early art education)
the three colors: Red, Yellow and Blue persist as primaries, and they
are known more formally as the Opaque Primaries.
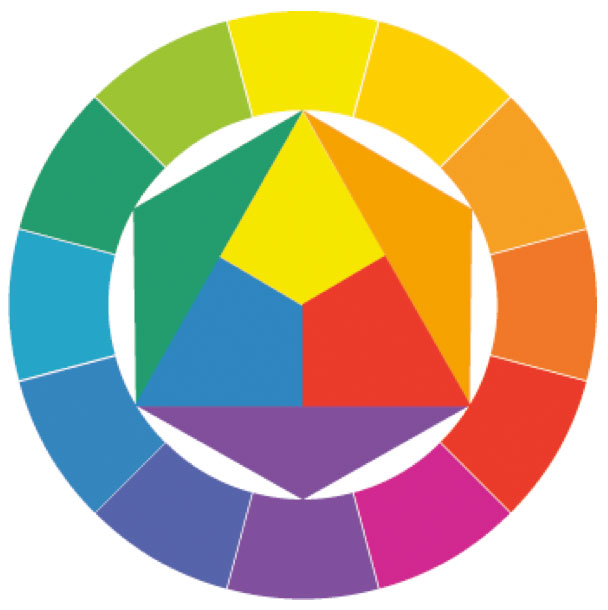
To form his color circle, Itten placed these primaries in the form of a triangle, with the brightest hue at the top.
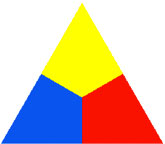
Stage 1: three colors
Around this triangle he added secondary colors, derived by mixing two adjacent primaries together,
employing elementary color algebra which is still taught to school children.
The process results in six spectral hues, forming the shape of a hexagon.
| blue + yellow = green |
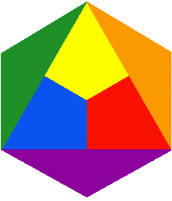 |
red + yellow = orange |
|---|
| red + blue = violet |
|---|

Stage 2: six colors
Mixing together each secondary with one or the other part of its component primaries, the tertiary
colors are derived, arranged in a ring around the hexagon.
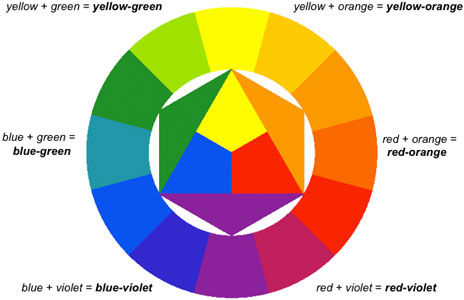
All together, this results in twelve spectral hues.

Stage 3: twelve colors
Now, consider at this point an obvious analogy which could be made between colors and pitches, given this
model.
If you immediately think of equating these twelve colors with twelve chromatic tones, you are not alone.
This is what has been done time and again, over and over throughout history, by countless people eager to
find relationships between colors and pitches. Many of these people have claimed to have made a brilliant new
discovery in so doing. A few examples are given below.
Macdonald, John Denis SOUND & COLOUR, Their Relations, Analogies, and Harmonies.
London; Groves, High Street, Gosport: Longmans, Green, Reader, and Dyer, 1869.
Jameson, D.D. Colour-music.
London: Smith, Elder, 1844.
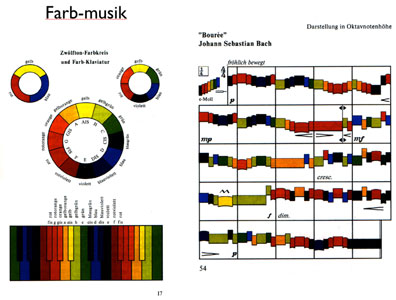
Fritz, Johannes and Dobretzberger, Paul.
Farb-Musik: Leitfaden für eine kombinierte Farben- und Musiklehre.
Berlin: Simon and Leutner Verlag, 1993.
Some form of Farb Musik has been used as a part of formal schooling in many parts of
Germany over the past decades, there being some tradition of the twelve-tone pitch to color analogy
in that part of the world.
Needless to say, such an analogy is not very sophisticated.
A simple observation can be made, that the color bands are not equally spaced within
the spectrum.
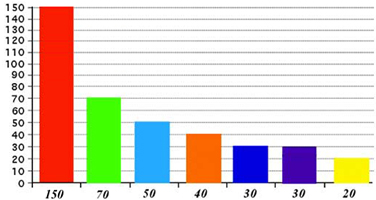
This elementary observation demonstrates that the idea of equating the colors with twelve
equidistant pitches actually makes very little sense.
The Harmonic Spectrum
There is however a very clear relationship between colors and pitches which can be found if we simply
set aside this notion of twelve equidistant pitches. After all, if colors are not man made things, then
why should they be equated with something which is so obviously man made, this twelve-tone scale?
Instead of starting with an artificial structure that is the result of human intervention,
it would make sense to deal only with basic elementary natural structures when looking for
relationships between colors and pitches.
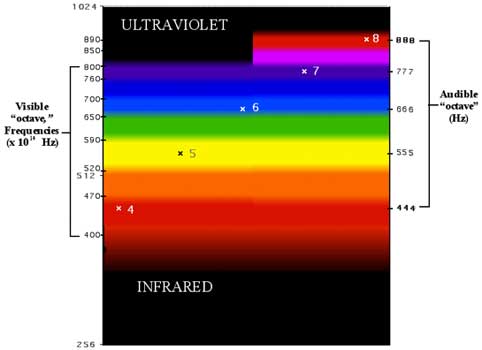
Let's take our diagram of the spectrum, turn it on its side and change the wavelengths to frequencies.
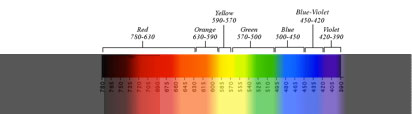
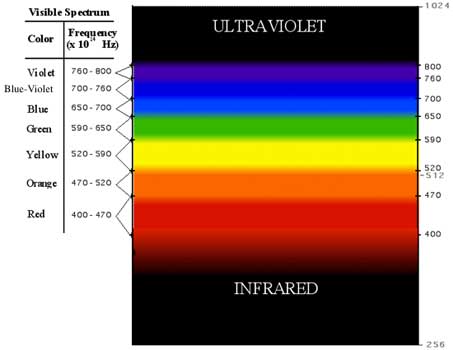
This diagram shows the color bands in a slightly exaggerated fashion; that is, because there are no
clear delineations between the categories, Itten's numbers are used here to demarcate the bands.
Before moving on, I want to remind you that these values were found to be consistent with reputable sources.
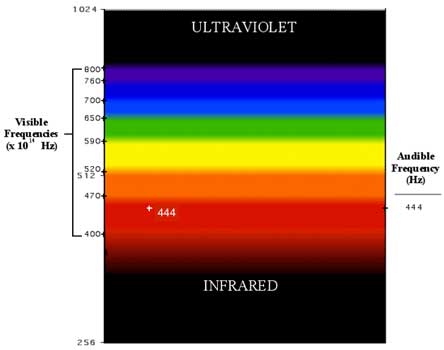
Mapping audible frequencies to the color bands of the electromagnetic spectrum is not a new idea;
it has been done by many other people; however, none of them have shown what I show here.
Note that I am not in any way suggesting that sound waves when sped up a billion times become light waves,
as is often suggested by others.
A frequency of 444 billion Hz falls squarely within the red band. Note that on the right side
of the diagram, this frequency is stated as 444 Hz, an audible frequency. Again, I stress that this is
not intended to suggest that light and sound wave phenomenae are at all the same; by most measures,
they appear to be fundamentally different.
The analogy is useful to show an apparent order which exists within the visible spectrum.
Now begins the astounding part. If this frequency is
used as the fourth member of a harmonic series, and frequencies are mapped at 555, 666, and 777 Hz,
the frequencies can be simplified to their place in a musical harmonic series; i.e. 444 Hz is simply 4,
555 Hz is 5, and so on, so that the following
gamut results.
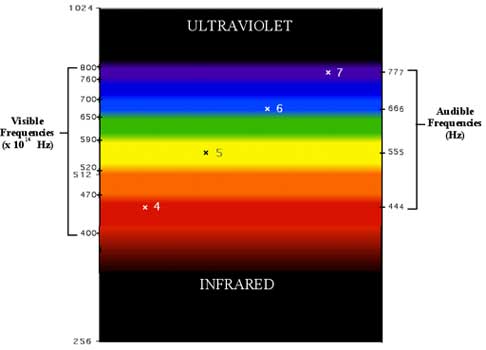
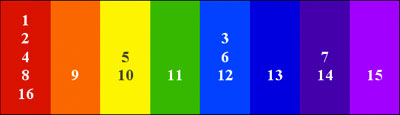
Each of the frequencies falls squarely within a color band.
Moreover, the frequencies fall in every other band in the spectrum.
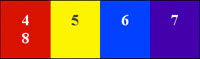
Summarizing the harmonic color bands, we have:

This set of colors omits every other band in the spectrum.
According to musical logic, 4 of a harmonic series is a duplication of 2, which is a duplication of 1, the
fundamental. It also follows that 8 is a duplication of 4. By changing 4 to 8, more harmonics in the series
can be mapped to the spectrum, giving the following results.
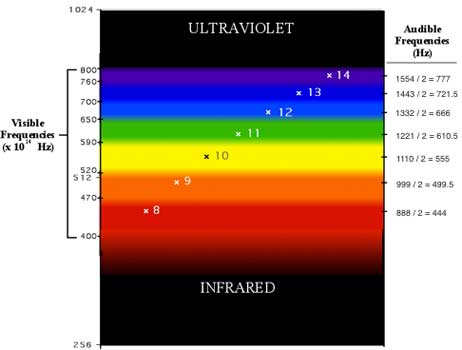
Almost as if by magic, the harmonics map to each of the color bands. What appears to be missing is an
octave completion within the spectrum.
Interestingly, some researchers have noted that towards the ultraviolet end of the
spectrum traces of visible red can be seen to return.
Because 4 and 8 are duplications, we can artificially extend the
spectrum into the ultraviolet range with a return to red where the harmonic number 8 falls.
Returning to our harmonic gamut, the fact that 4 and 8 are duplications is shown by placing them
on the same color.
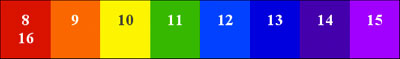
To show the entire harmonic order, we can return to the series beginning on 8, and map harmonics
8 through 16.
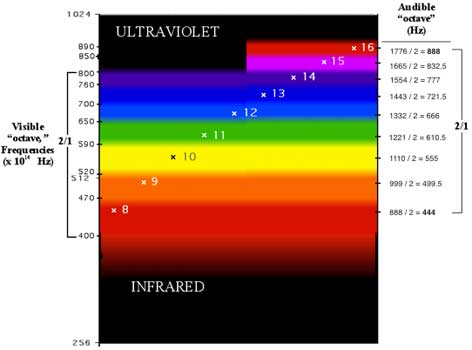
The result is a gamut of eight harmonic colors shown below.
The continuous nature of the musical harmonic series can be shown on the diagram by artificially extending the
color bands into the infrared and ultraviolet regions.
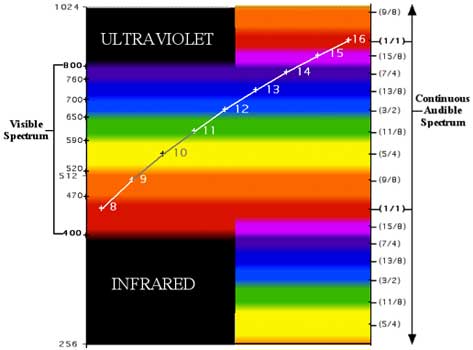
The result is a gamut of harmonic colors, in which members of the harmonic series that duplicate each
other are mapped to the same color.
At this point it makes sense to pause and compare these findings with Newton's. Recall that Newton said that the
order in the spectrum was based on ratios of a Dorian scale in Just Intonation. I checked my findings against
Newton's scale, and in fact his data fits within harmonic order just fine.
His error was not that the scale could not be found
in the spectrum; it was simply that a scale is not the ordering principle; the ordering principle is obviously
harmonic in nature. Why this is not common knowledge is beyond me.
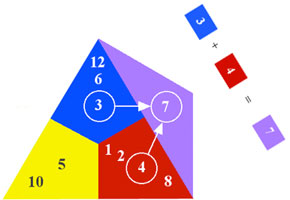
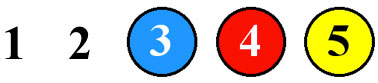
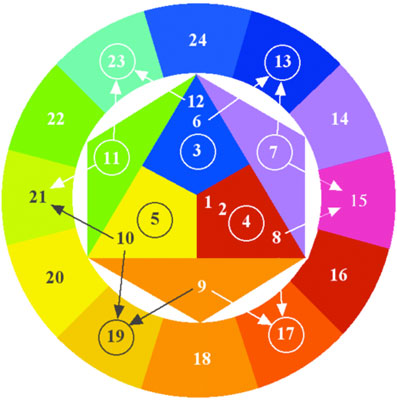
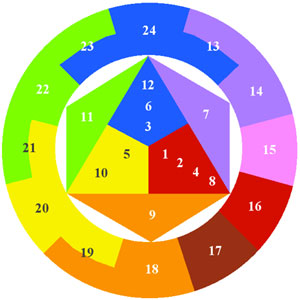
Now back to business. The harmonic gamut can be used to rebuild Itten's color circle, showing an astoundingly simple
harmonic order within the structure. We begin with a triangle of the three primary hues, placing the darkest hue on
top.

The reason for placing Blue on the top is that blue is the number 3, and the structure will be built
with harmonics ascending in clockwise order. Around this small triangle, Itten's central primary triangle is built.
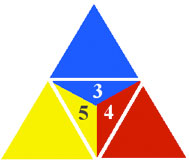
The duplicate harmonics within this structure can be shown, with the generating harmonics circled.
The circled harmonics correspond to prime numbers in every case but the number 4.
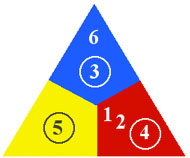
Stage 1: three colors
The reason for circling 4 is made apparent by what follows; i.e. that the rest of the color circle is generated by
applying a simple principle of arithmetic summation. If you are averse to mathematics, just
skip ahead.
where b = a + 1
What is shown here is that arithmetic summation is the same as finding an arithmetic mean. Either method
arrives at the same result. For example, both equations can be used
to arrive at our first secondary harmonic color, 7.
The harmonic color 7 is shown to be a summation of 3 + 4 = 7, which is the same
as Blue + Red = Violet.
The rest of the colors follow in like fashion. 4 + 5 = 9, is the same as Red + Yellow = Orange.
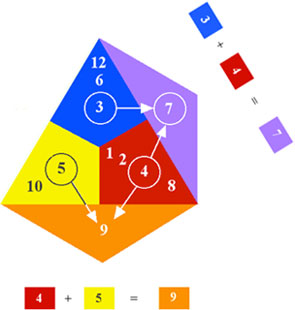
Likewise 5 + 6 = 11, is the same as Yellow + Blue = Green.
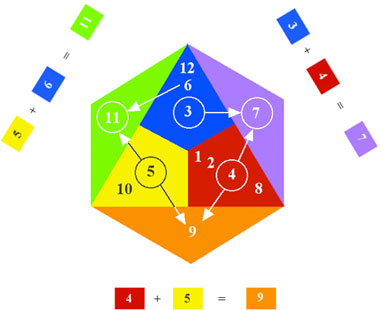
Stage 2: six colors
This gives six colors in all.
Extending these colors outward into an incomplete ring gives us room to complete the same process for the
tertiary colors.
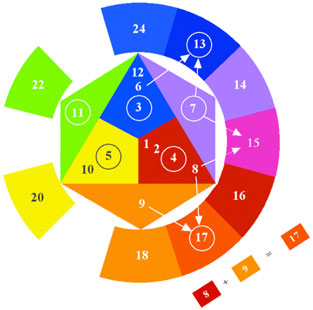
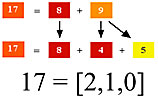
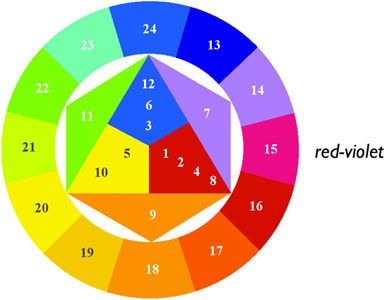
Blue + Violet = Blue-Violet, just as 6 + 7 = 13.
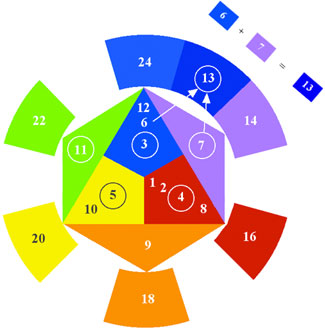
Red + Violet = Red-Violet, just as 7 + 8 = 15.
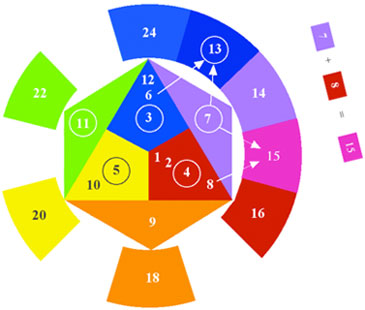
Red + Orange = Red-Orange, just as 8 + 9 = 17.
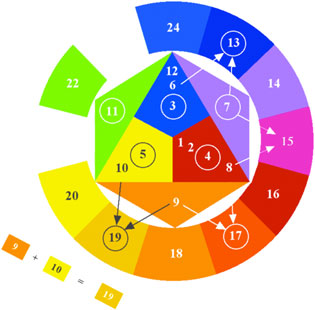
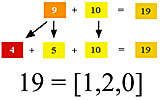
Yellow + Orange = Yellow-Orange, just as 9 + 10 = 19.
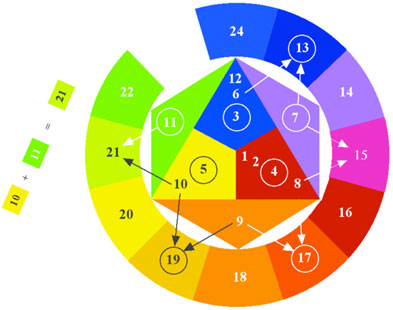
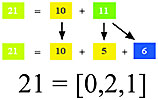
Yellow + Green = Yellow-Green, just as 10 + 11 = 21.
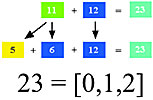
Blue + Green = Blue-Green, just as 11 + 12 = 23.
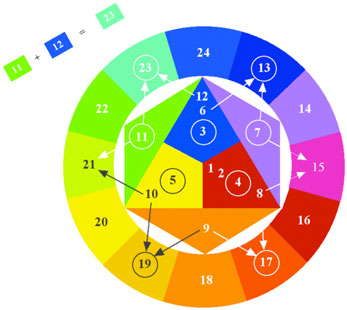
Stage 3: twelve colors
Twelve colors in all. Note that the harmonic
color wheel has Blue at the top, and that with each stage in the color wheel, we find that the number 3
determines the number of total colors. That is, in the primary stage, there are 3 colors. At the secondary stage,
there are 3 x 2 = 6 colors. At the tertiary stage, there are 3 x 2 x 2 = 12 colors. And so on, at each
stage, the number of colors will double. This is a basic principle of the musical harmonic series.
Each stage is equivalent to a musical octave, and within each next octave of a musical harmonic series,
the number of pitches is doubled.
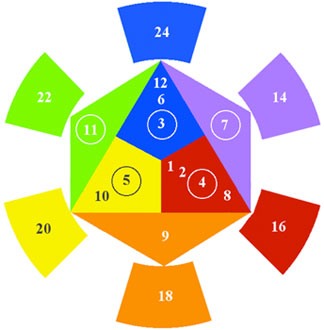
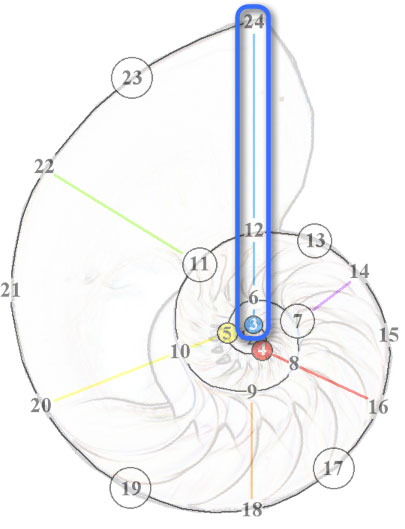
What is actually happening here can be shown in a slightly different way,
beginning again with the three primaries as 3, 4 and 5.
We place these again in a triangular structure.
Instead of building the color wheel, we will build a slightly different shape.
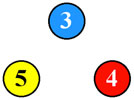
The first stage actually accounts for all integers between 1 and 6, as shown below.

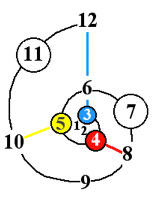
The second stage continues the structure to include all integers up to 12.
The third stage doubles the limit to 24.
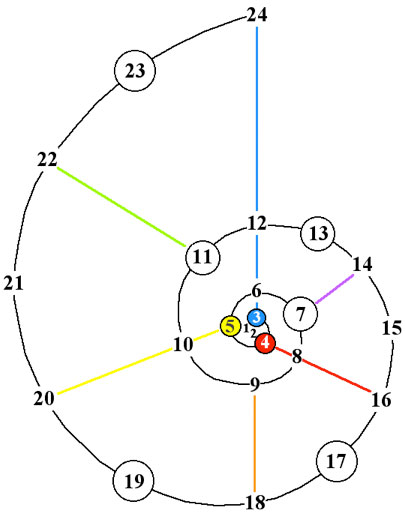
The structure shown is that of a logarithmic spiral, a structure occurring naturally in nature, such
as in the shell of the chambered nautilus.
The harmonic number 3 an all its harmonic duplicates (all powers of 2 times 3) is shown to
be the primary element which organizes the structure.
What is really happening here is that numbers and colors are being linked together harmonically.
A language of color numbers results. I have called this language trichromatic number theory.
Any color can be given a numeric value as a mixture of primary colors. For example:
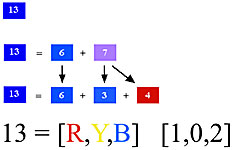
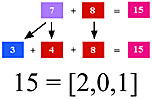
It should be noted that every color is a mixture of only two of the three primaries; that is,
none of the harmonic colors mixes all three primaries together. This makes sense when the principle of
arithmetic summation is considered.
The premise is very simple and it can be used to generate an unlimited set of harmonic color relationships.
From the color wheel which spans from 1 to 24 ...
... a larger color wheel extending up to 24 x 2 = 48 can be made.
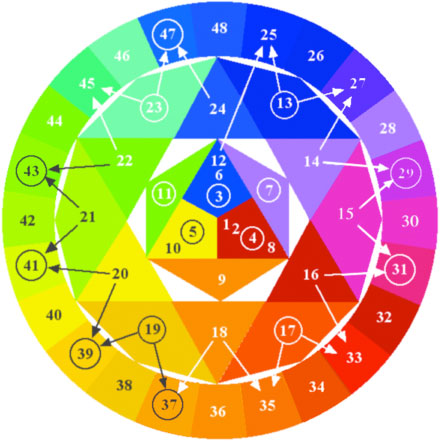
The first circle in effect represents 23-Limit Just Intonation, while the second circle represents
47-Limit Just Intonation.
Categorical Perception
You might notice that the larger color circle contains colors on its outer circle
that are difficult to distinguish or categorize at a glance. This brings us to a discussion of
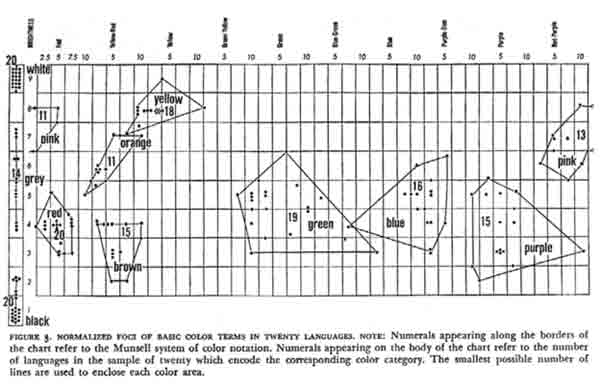
color categories, and the limits of perception. The most cited work in this area comes from
Berlin and Kay, Basic Color Terms, 1969. Their study involved researching lexical color
terms from over twenty languages around the world in order to find commonalities between the
languages. The idea is that if most languages have a word for a given color, that color must be
categorical, or a color that is easily perceived as distinct, and is universally
recognized. Their findings are summarized in the table below.
Berlin, Brent, and Paul Kay.
Basic Color Terms; Their Universality and Evolution.
Berkeley: University of California Press, 1969.
To make clear the relationship between these findings and harmonic colors, it can be shown that
the three primary and three secondary colors of the color wheel are included in the categorical hues.
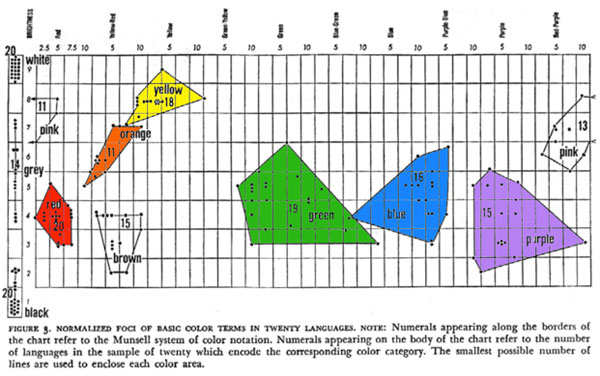
In addition to these six colors, are two colors which are not on the color wheel: Pink
and Brown. Note also that the achromatics, Black, White, and a number of Gray scales, are also included.
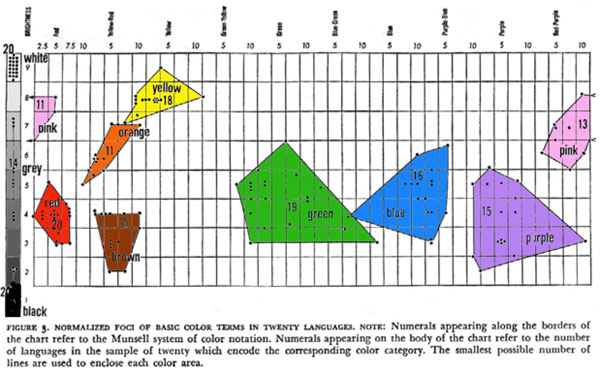
These eight colors: Red, Yellow, Blue, Green, Orange, Violet, Pink, and Brown, are the chromatic
categorical hues. They are also called preattentive colors by vision scientists, meaning that
no conscious effort is needed to recognize these colors.
In order to make harmonic colors as practical as possible, it makes sense to apply the basic principles of
these findings to the 23-Limit harmonic color wheel. If we consider the color Red-Violet ...
... lightening or tinting of this color yields Pink, which is indeed more a immediately
recognizable color.
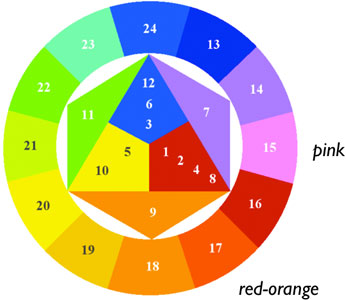
Consider also the tertiary color Red-Orange. Darkening, or shading this color yields
Brown, which is also in fact more immediately recognizable.
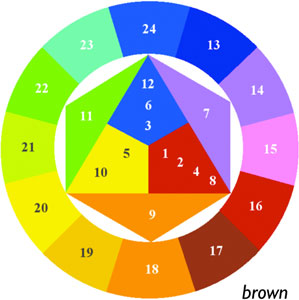
If the remaning tertiary colors are shown as combinations of the categorical hues,
the color wheel gains a new immediacy, expressed as a shape built only from colors that are
immediately recognizable.
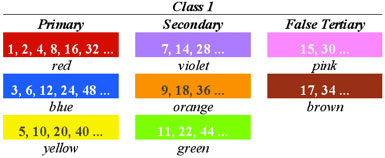
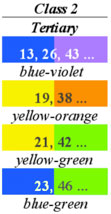
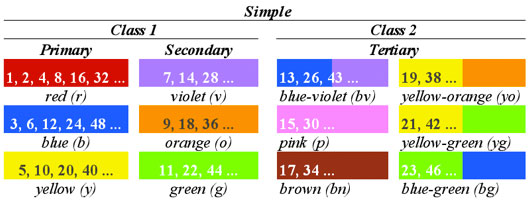
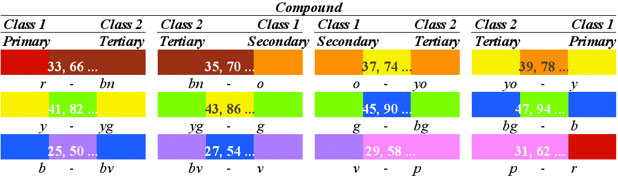
These basic harmonic colors can be placed into two classes. Class 1: the Preattentive colors,
and Class 2: colors which are mixtures of the preattentives.
This logic can be put to work on the larger 47-Limit harmonic color wheel as well. The structure then appears
greatly simplified in terms of color recognition.
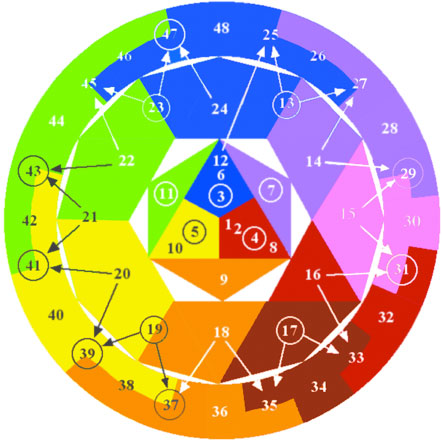
All harmonic colors from 1 to 47 are represented in the outer ring.
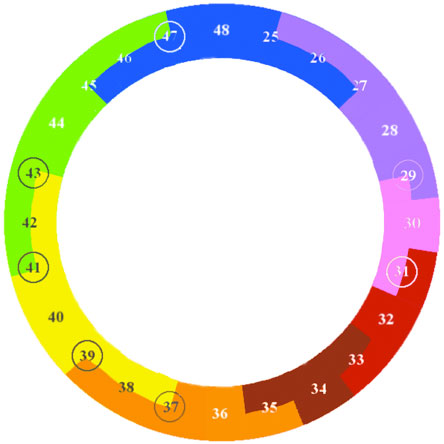
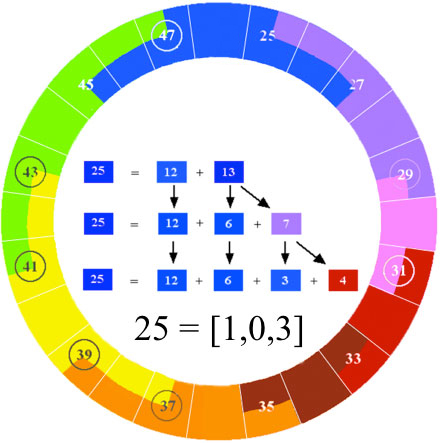
Isolating only those colors unique to the 47-Limit, it can be shown that each of these unique colors
is a mixture of 3 parts of one primary and 1 part of another. For example, 25 reduces to 3 parts Blue and
1 part Red.
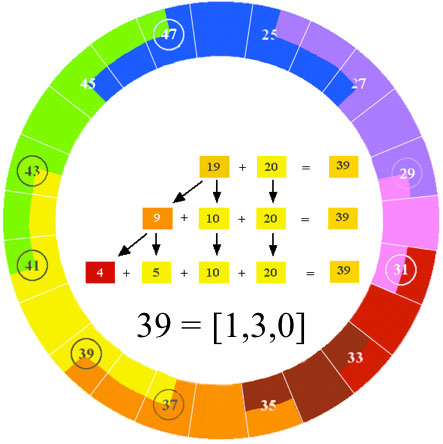
39 reduces to 3 parts Yellow and 1 part Red.
The 23-Limit harmonic colors can be further classified as Simple and the 47-Limit can be
called Compound, as summarized the the tables below.
This is the basic system of H-Chroma, founded on the harmonic order of the visible
spectrum which I observed first in the year 2000. H-Chroma is a quantitative tone chroma of
harmonic colors organized categorically, allowing practical applications
for Just Intonation up to the 47-Limit.
The text ends here for now. I have developed a notation system for music in Just Intonation using H-Chroma,
and have also written software, and designed and built an electronic musical instrument based on these principles.
Presentation of those things will follow when time permits.